QuickStart reference for RDI controlled JTAG debug interfaces
Getting started with an RDI-controlled JTAG debug interface
To use any of the RDI controlled JTAG debug interfaces available on the market, you must configure the hardware and the software drivers involved.
Abatron BDI1000/BDI2000
Follow these instructions to configure the Abatron BDI1000/BDI2000
-
Connect the debugging hardware to your host computer and turn it on. You must use the serial interface to initialize and configure the BDI1000/BDI2000 the first time.
-
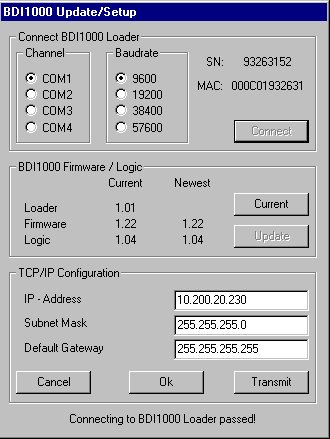
Start the application
B10ARM.exe and choose Setup>Firmware. In the dialog box that is displayed, select the channel and communication speed you are going to use.
-
Click Connect to refresh the information about the current firmware and logic versions. If necessary, update the firmware and logic software. For more information about how to update firmware and logic, refer to the BDI1000/BDI2000 documentation.
-
To use the IP interface, you must also specify an IP address. Type the address and click Transmit. Then click Ok to close the dialog box.
-
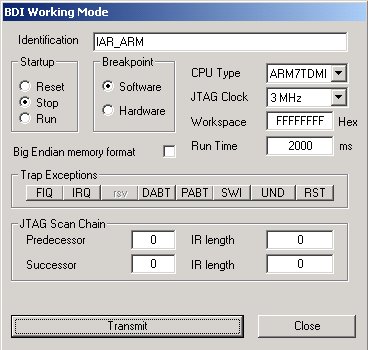
Now choose Setup>Mode to open the BDI Working Mode dialog box.
-
Select the correct CPU Type option and set the Startup behavior to Reset, Stop, or Run, according to the needs of your hardware:
Reset
Reset will be executed after reset or power-up. This will reset all
registers and SFRs.
Stop
The target CPU will be set to execute for the number of milliseconds specified in the Run Time option before it will be stopped.
Run
The target CPU will be put in Run mode after reset or power-up.
For a board such as the at91eb55 with external memory that will be configured
from ROM during boot-up, select Stop. This will allow the processor
and memory to be configured before you start the debug session.
You have now finished the BDI1000/BDI2000 hardware setup. Now you must configure the IAR Embedded Workbench:
-
Start the IAR Embedded Workbench and open the
tutor example project. This project has been preconfigured to use the simulator driver, so to run the BDI1000/BDI2000 you must change the driver.
-
Choose Project>Options and select the C-SPY category.
-
Change the Driver option to RDI.
-
Go to the RDI page of the C-SPY options, select the manufacturer driver (
BDIRDI.DLL) and click OK.
-
Make sure that you have a linker command file that matches your hardware. To select a linker command file, choose Project>Options and go to the Include page of the XLINK category.
Now an extra menu, RDI, has been added to the menu bar.
-
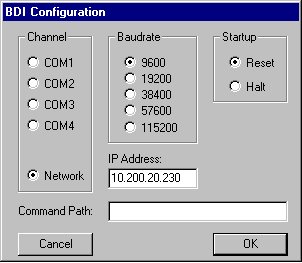
Choose RDI>Configure to display the RDI-driver-specific setup dialog box. Select the communication settings you want to use and click OK. In this example, the network connection is used.
The settings you make are saved in the file BDIRDI.rdi-cfg, located in the same directory as the manufacturer's driver (BDIRDI.DLL), and will be used the next time you start a debug session.
-
You can now start the debug session. Choose Project>Debug (or click the C-SPY button on the toolbar) to download the code to the target and start debugging.
ARM Multi-ICE
Follow these instructions to configure the ARM Multi-ICE:
-
Install the Multi-ICE software package from ARM.
-
Connect the debugging hardware to your host computer. Make sure that the Multi-ICE and the target board have been turned on.
-
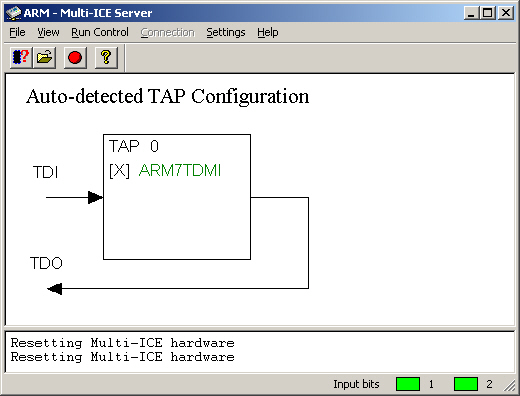
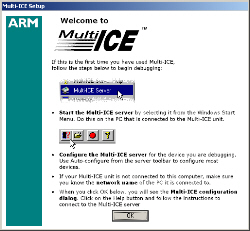
When the installation is completed, start the Multi-ICE server software.
Choose File>Auto-Configure. Now the server software scans the tool chain to retrieve information. When it has finished, the configuration view will be refreshed.
You have now finished the Multi-ICE hardware setup. Now you must configure the IAR Embedded Workbench:
-
Start the IAR Embedded Workbench and open the
tutor example project. This project has been preconfigured to use the simulator driver, so to run the Multi-ICE you must change the driver.
-
Choose Project>Options and select the C-SPY category.
-
Change the Driver option to RDI.
-
Go to the RDI page of the C-SPY options, select the manufacturer driver (
Multi-ICE.dll) and click OK.
-
Make sure that you have a linker command file that matches your hardware. To select a linker command file, choose Project>Options and go to the Include page of the XLINK category.
Now an extra menu, RDI, has been added to the menu bar.
-
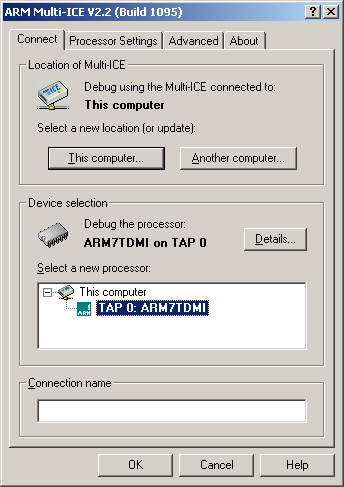
Choose RDI>Configure to open the RDI-driver-specific setup dialog box. The first time you open the dialog box, a welcome screen is displayed. Click OK to proceed to the setup dialog box.
-
If there are more than one target CPU present in the tool chain, select the target you want to debug. Close the dialog box.
-
The settings you make are saved in the file
Multi-ICE.rdi-cfg, located in the same directory as the manufacturer's driver (Multi-ICE.dll), and will be used the next time you start a debug session.
-
You can now start the debug session. Choose Project>Debug (or click the C-SPY button on the toolbar) to download the code to the target and start debugging.
Ashling Opella
Follow these instructions to configure the Ashling Opella:
-
Install the Opella software package from Ashling. The driver should be version 1.0.4g or later.
-
Connect the debugging hardware to your host computer.
-
Start the IAR Embedded Workbench and open the
tutor example project. This project has been preconfigured to use the simulator driver, so to run the Opella you must change the driver.
-
Choose Project>Options and select the C-SPY category.
-
Change the Driver option to RDI.
-
Go to the RDI page of the C-SPY options, select the manufacturer driver (
Opella.dll) and click OK.
-
Make sure that you have a linker command file that matches your hardware. To select a linker command file, choose Project>Options and go to the Include page of the XLINK category.
Now an extra menu, RDI, has been added to the menu bar.
-
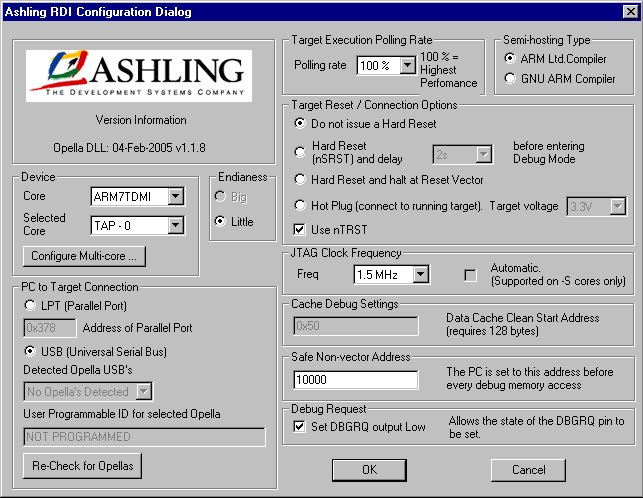
Choose RDI>Configure to open the RDI-driver-specific setup dialog box. Select the Processor, JTAG Clock Frequency and USB or Parallel Port to be used and click OK. Note that the JTAG clock frequency determines the communication speed between Opella and the target CPU.
-
The settings you make are saved in the file
Opella.cnf, located in the same directory as the manufacturer's driver (Opella.dll), and will be used the next time you start a debug session.
-
You can now start the debug session. Choose Project>Debug (or click the C-SPY button on the toolbar) to download the code to the target and start debugging.
AIJI System OPENice32
Follow these instructions to configure the AIJI System OPENice32:
-
Install the OPENice32 software package from AIJI System.
-
Connect the debugging hardware to your host computer.
-
Start the IAR Embedded Workbench and open the
tutor example project. This project has been preconfigured to use the simulator driver, so to run the OPENice32 you must change the driver.
-
Choose Project>Options and select the C-SPY category.
-
Change the Driver option to RDI.
-
Go to the RDI page of the C-SPY options, select the manufacturer driver (
OPENice32_A900.dll) and click OK.
-
Make sure that you have a linker command file that matches your hardware. To select a linker command file, choose Project>Options and go to the Include page of the XLINK category.
Now an extra menu, RDI, has been added to the menu bar.
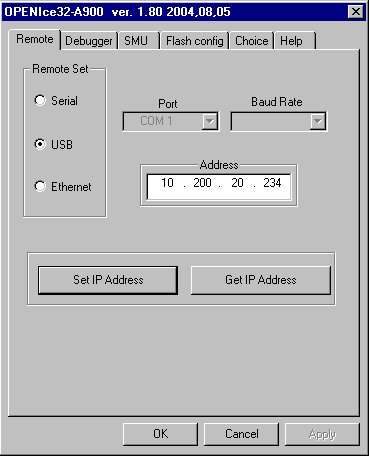
- Choose RDI>Configure to open the RDI-driver-specific setup dialog box. Select the communication port you want to use and click OK. In this example the USB port has been selected.
The settings you make are saved in the file OPENice32_A900.rdi-cfg, located in the same directory as the manufacturer's driver (OPENice32_A900.dll), and will be used the next time you start a debug session.
-
You can now start the debug session. Choose Project>Debug (or click the C-SPY button on the toolbar) to download the code to the target and start debugging.
Copyright © 1999-2020 IAR Systems AB.